Enhancing data visualization in PDFs with Doppio and Chart.js!
The Stack
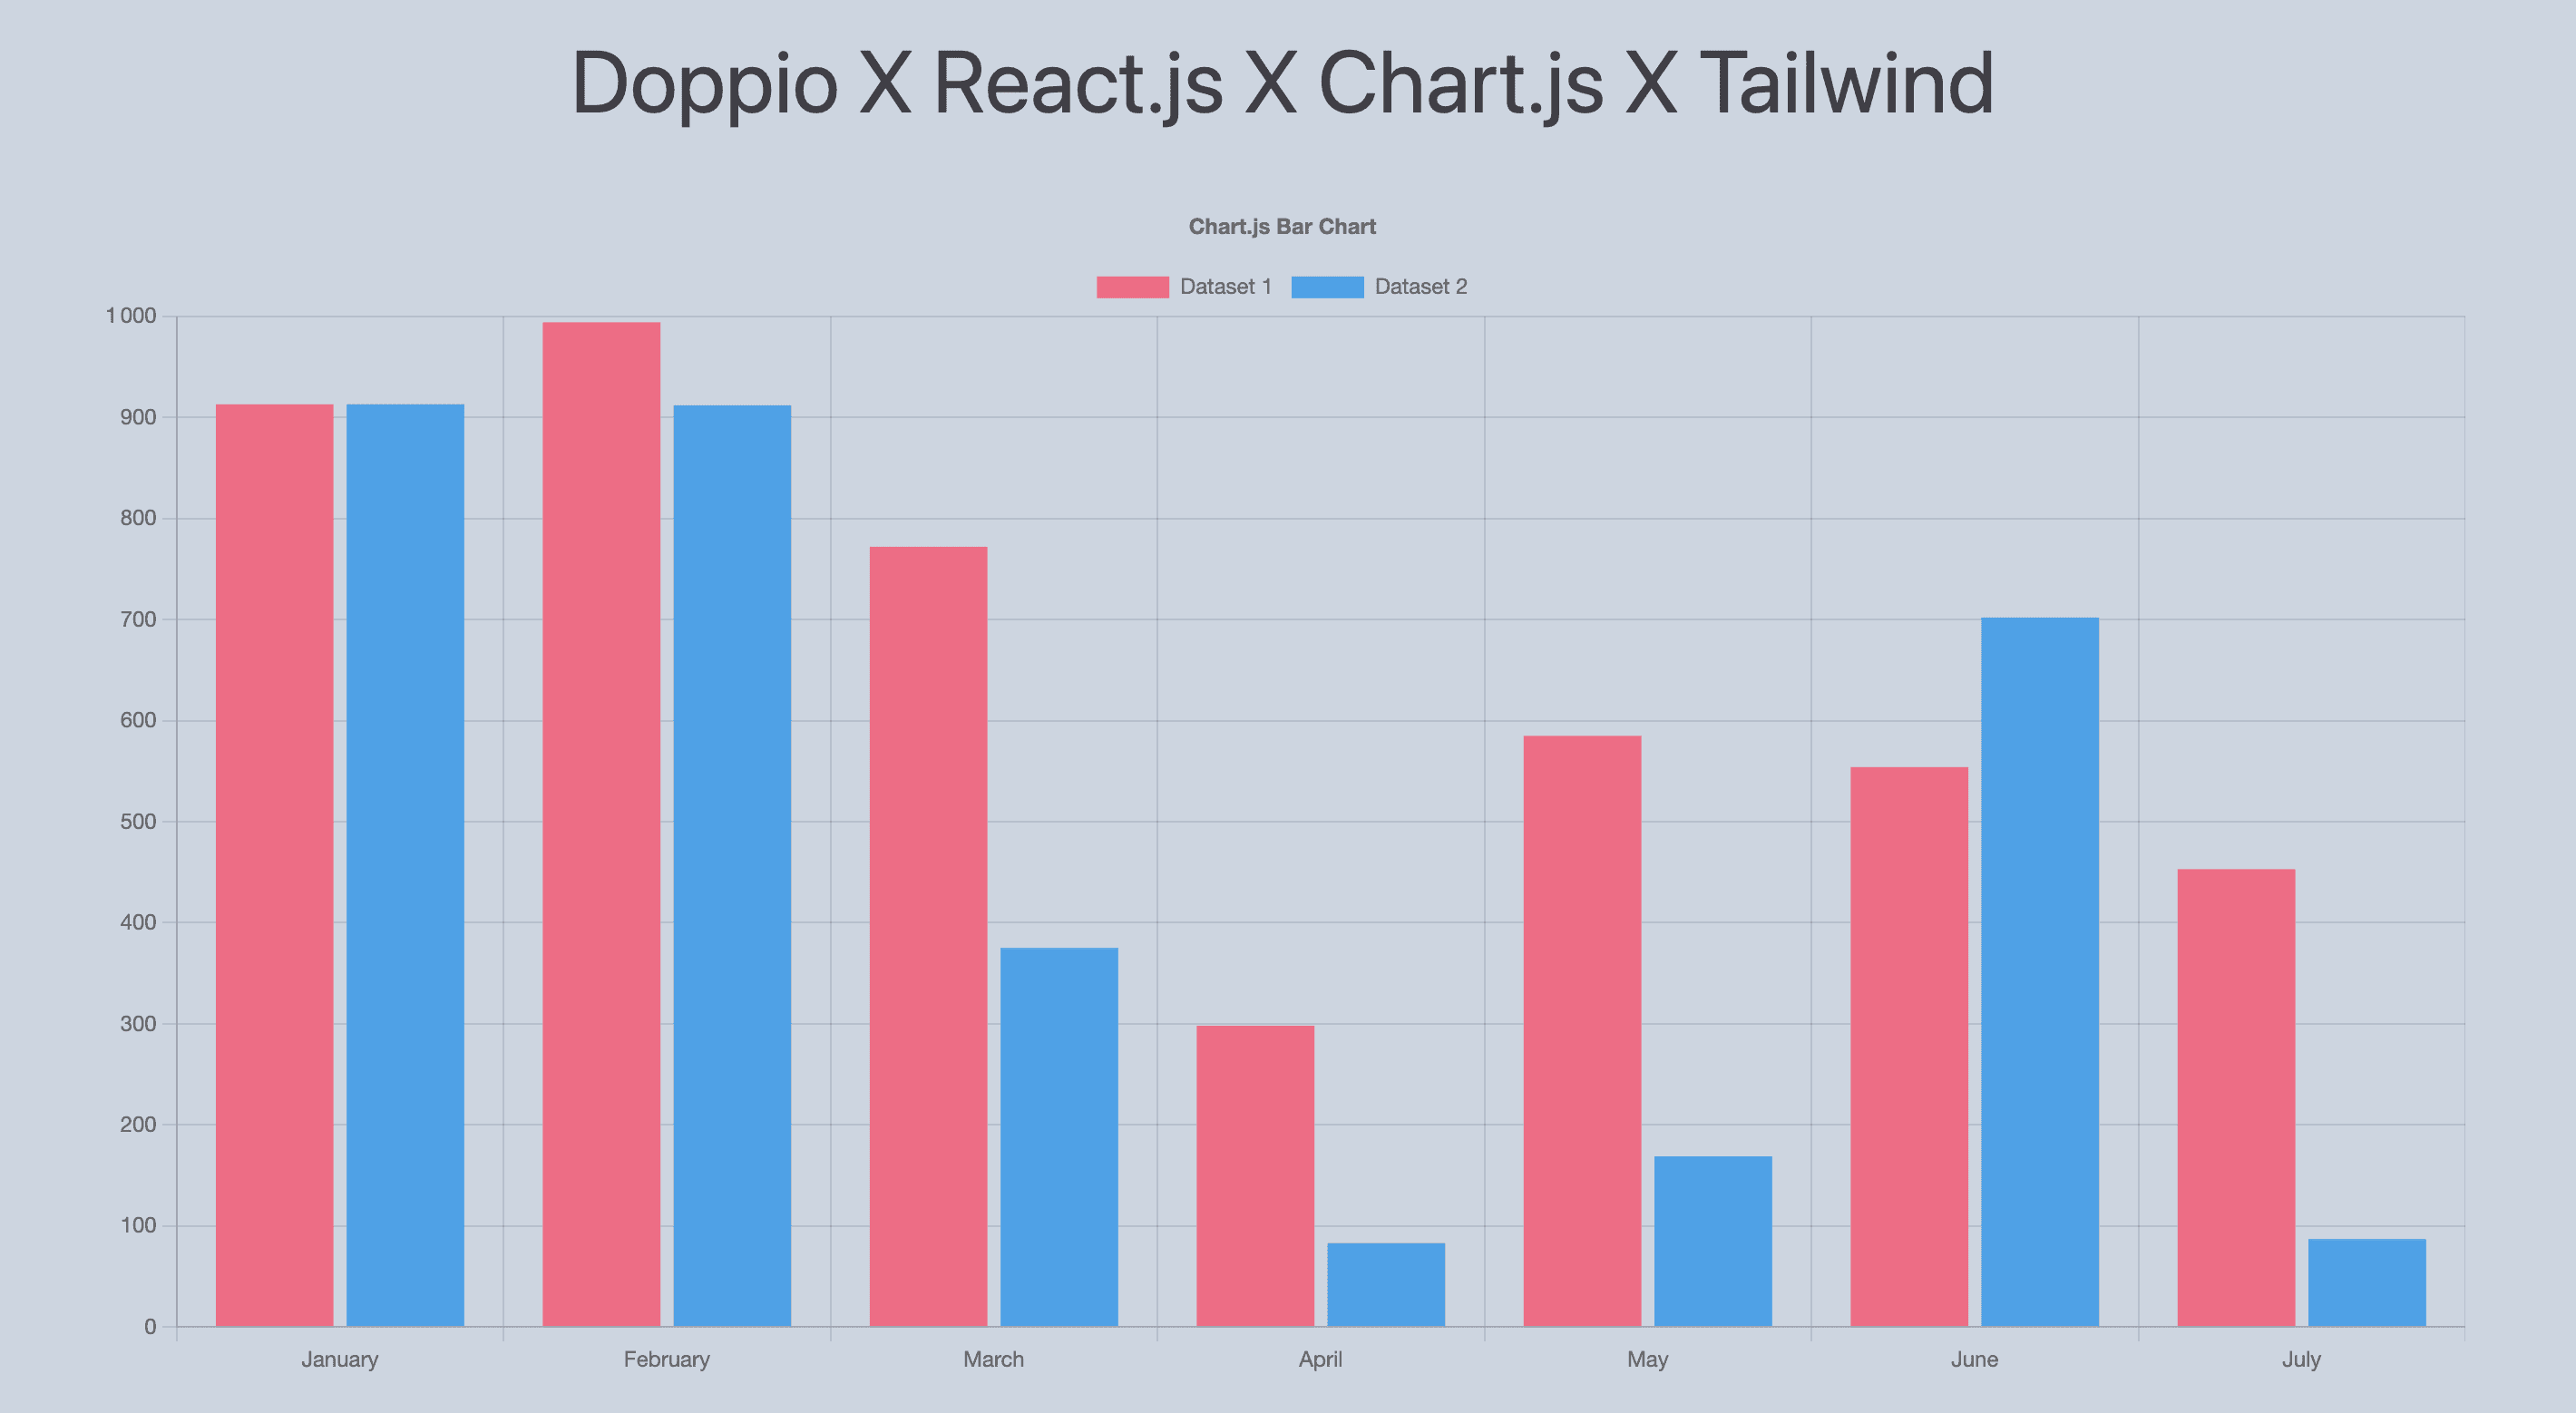
In this tutorial, we combine three powerful tools:
- React: For building the component
- Chart.js: For data visualization
- Tailwind CSS: For styling
Setting Up
Create a new React project with Tailwind and install Chart.js:
npx create-react-app my-pdf-charts
cd my-pdf-charts
npm install chart.js react-chartjs-2
npm install -D tailwindcss
Creating the Chart Component
Build a React component with Chart.js that will look great in your PDF:
import { Bar } from 'react-chartjs-2';

const ReportChart = ({ data }) => {
  return (
    <div className="p-8 bg-white rounded-lg shadow">
      <h2 className="text-2xl font-bold mb-4">
        Monthly Revenue
      </h2>
      <Bar data={data} options={{ responsive: true }} />
    </div>
  );
};
Generating the PDF
Deploy your React app and use Doppio to generate a PDF from the URL. The Chart.js charts will render beautifully because Doppio uses Chromium which fully supports the Canvas API.
curl -X POST https://api.doppio.sh/v1/render/pdf/sync \
  -H "Authorization: Bearer YOUR_API_KEY" \
  -H "Content-Type: application/json" \
  -d '{
    "page": {
      "goto": {
        "url": "https://your-react-app.com/report"
      },
      "pdf": {
        "printBackground": true
      }
    }
  }'
The result is a professional PDF with interactive-quality charts, styled with Tailwind CSS.